Description
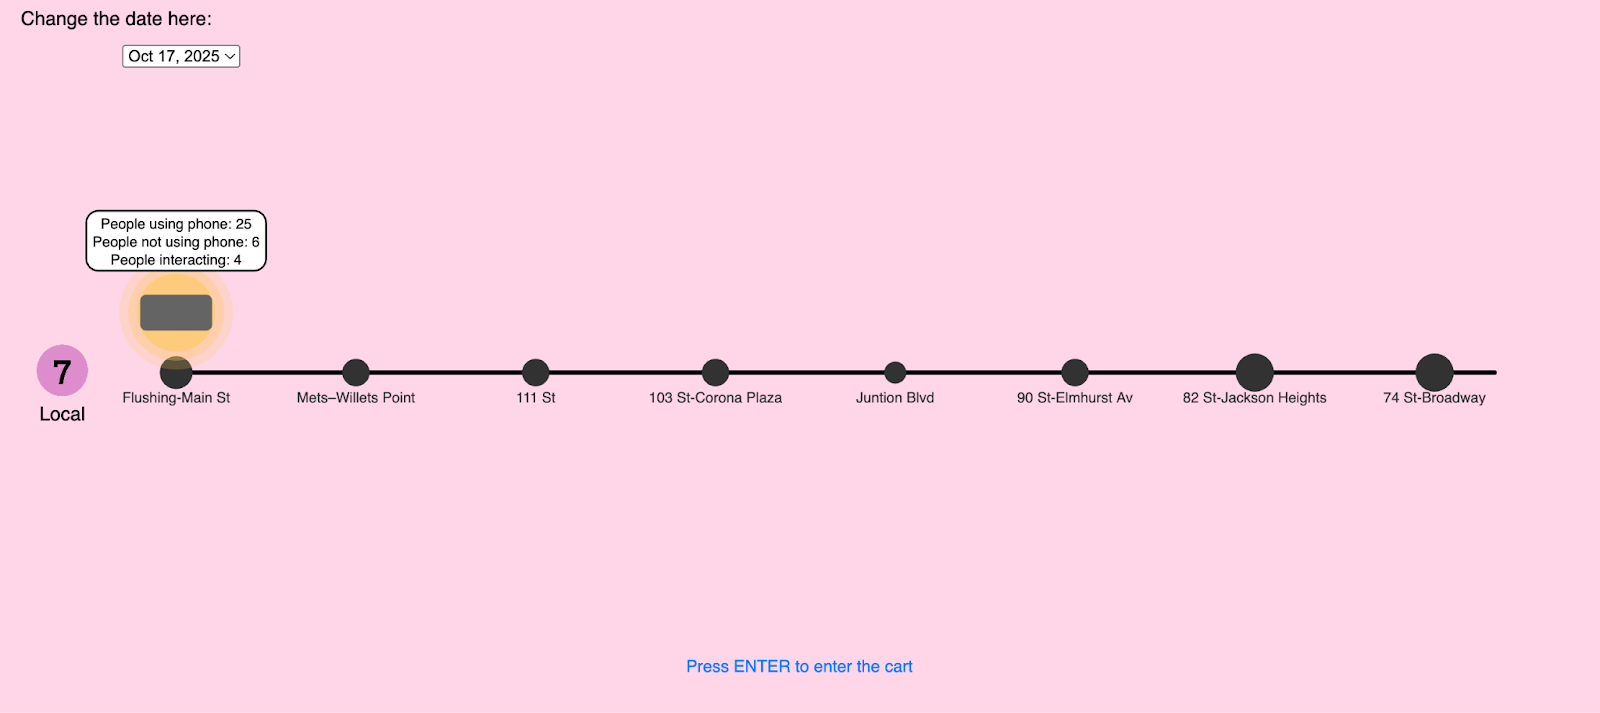
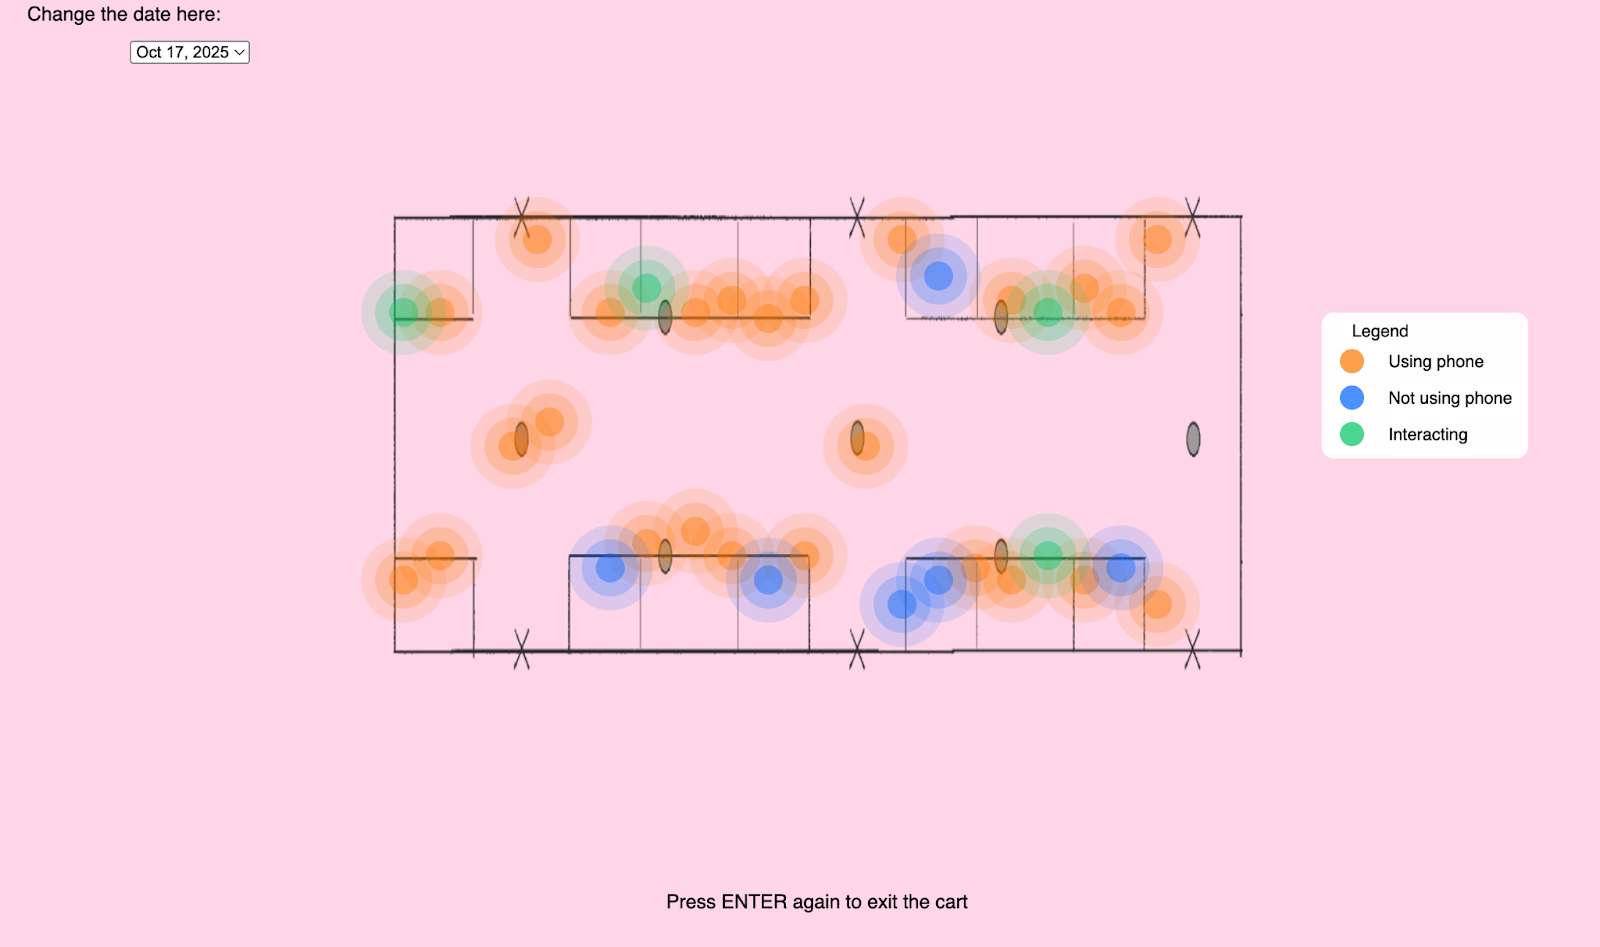
This project visualizes human behavior in the first cart of the 7 local train between Flushing–Main St and
74th St–Broadway, based on three days of data I collected on how passengers used their phones, interacted,
or remained disengaged. Users can explore each station, view heat maps, and compare patterns across days,
with light and color reflecting the energy and individuality of the environment.
The visualization emphasizes personal presence within a shared space, revealing how people occupy the same
environment yet often remain isolated or disconnected.
Technical Approach
Skills: HTML, CSS, JavaScript
I built the Subway visualization using JavaScript, with interactive features allowing users to drag the cart
to explore each station, toggle between dates, and view the cart’s heat map. HTML and CSS were used to
display the visualization and the project description on the webpage.