Music Diary
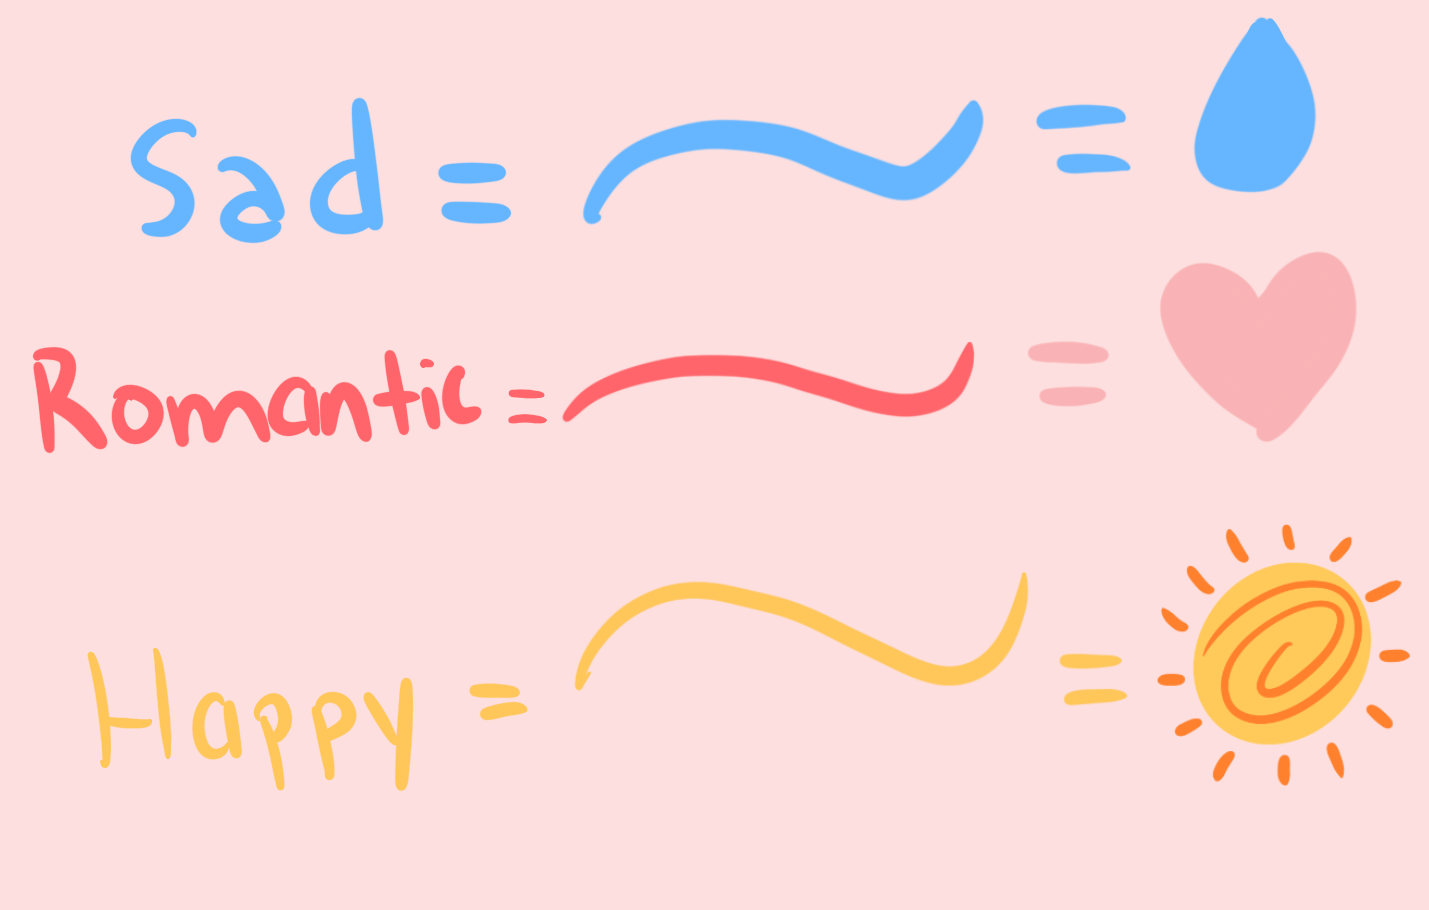
For this project, I wanted to visualize my habits, so I recorded the three main types of music I usually listen to—romantic, sad, and happy. Each one is represented by a colored line (red, blue, yellow) and a symbol (heart, droplet, sun). The line with the most data shines, and symbols shift in size and number based on input. The symbols also change position randomly each time the page is refreshed, adding a playful, dynamic element to the visualization. Pressing the space bar changes scenes, each with its own data to reflect different activities, while pressing “C” clears everything to restart. This project became a way for me to track the number of songs of each type I listen to depending on what I’m doing, while also giving myself control to reset whenever I want.
Below is the key for the symbols and lines: